Map Making
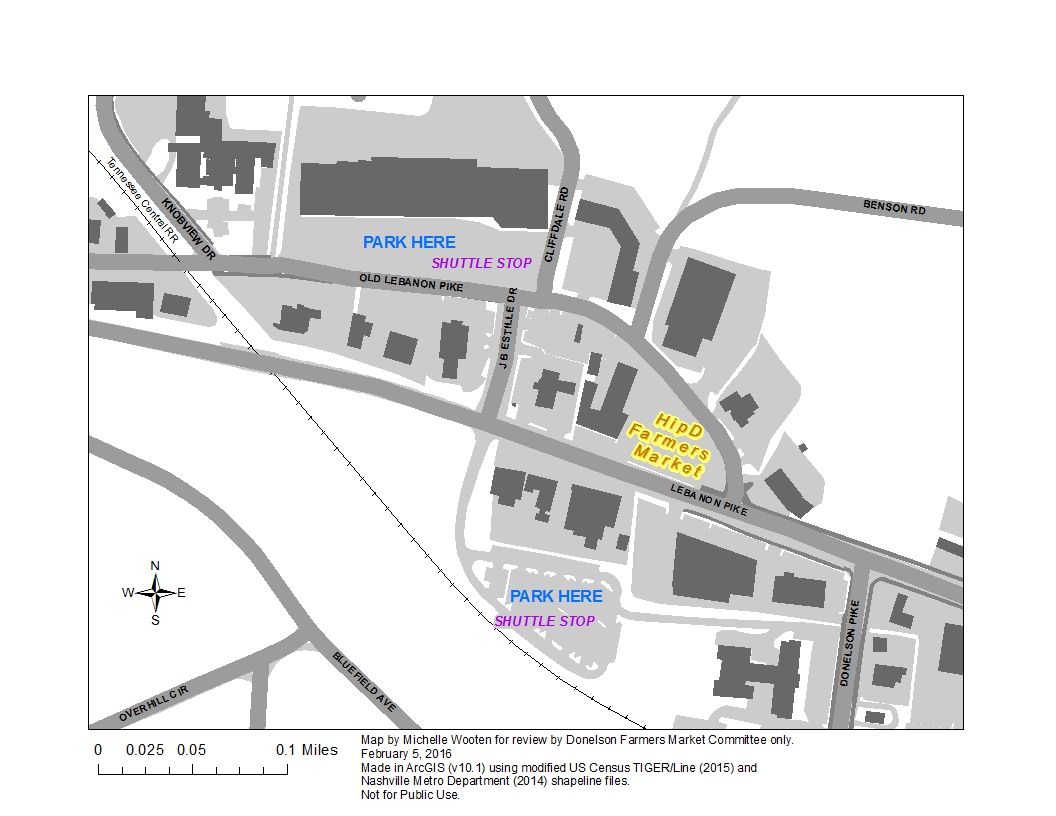
Local Farmer’s Market Parking and Shuttle Map. I volunteered for the Donelson Farmer’s Market Committee in Nashville in 2016 and one of my efforts was the creation of the above map in ArcGIS. The map was intended to help people in my community and beyond locate parking and shuttle locations, which are not easily identifiable on Google Maps. I received approval from Nashville Metro to map their current sidewalk and building layers interposed with U.S. Census TIGER line files.
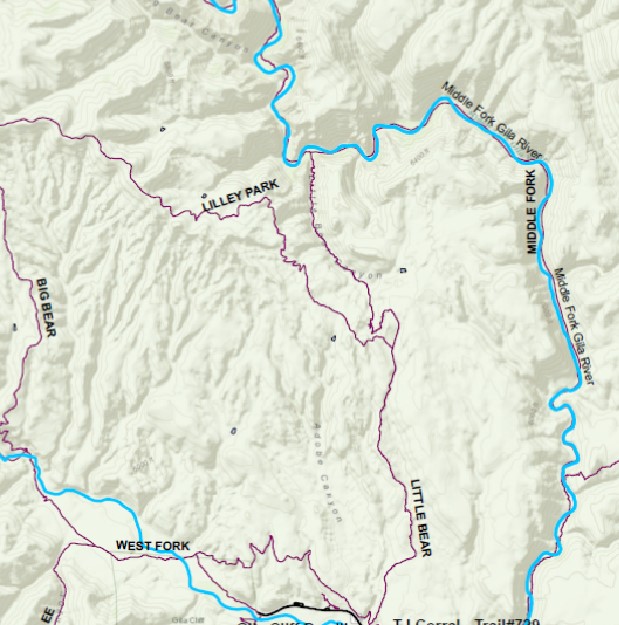
Backpacking Trail Map. We went hiking in the Gila National Forest during blooming season in October. To compose this map in ArcGIS, I downloaded trail, flowline, recreation points, and road layers from the Gila National Forest from the USDA’s website and selected out desired features.
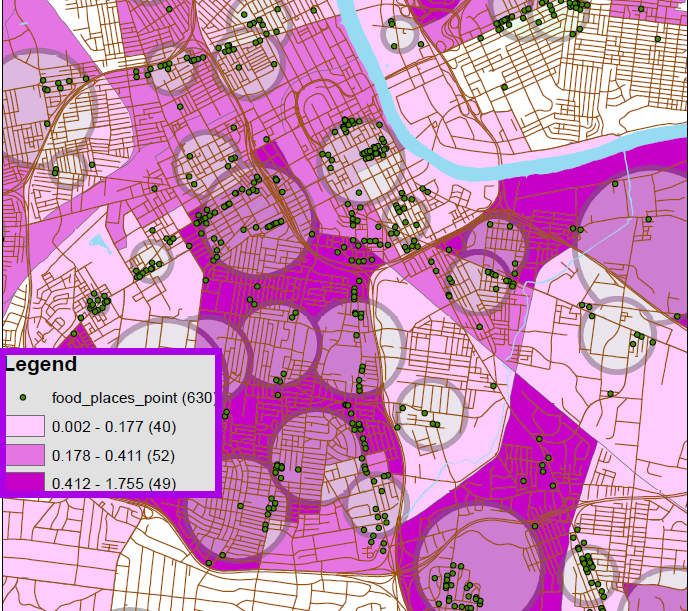
Food Access Analysis Map. Using ArcGISs Feature to Point, Standard Distance, and Calculate Area functions, I generated standard deviation circles of food-access locations within each census tract in a city of interest. The above map indicates low, medium, and high access based on quantiles. I then calculated the ratio of the standard deviation area to the the area of the census tract as one measure of food access (e.g. the higher the ratio, the higher the food accessibility per census tract). Next, I performed a multinomial logistic regression to see if various demographic census variables (related to socioeconomic status) were significant predictors of belonging to a particular level of access. This was an informal analyses conducted for my final project in my doctoral course in Advanced Regression with Dr. Youn-Jeng Choi.
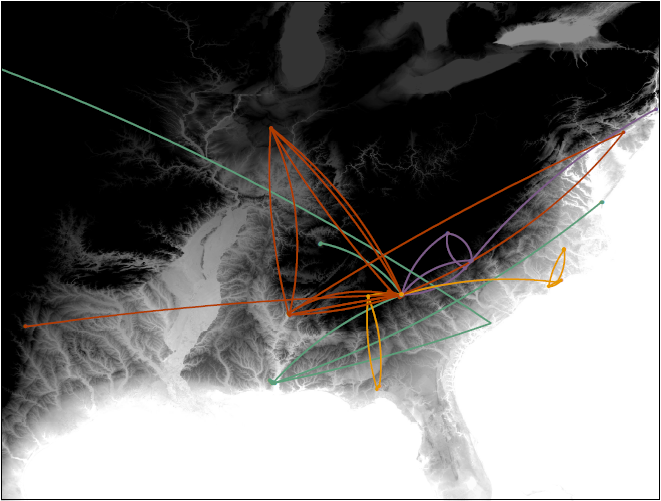
Travel Lines. I used ArcGISs Geodetic Lines to visualize several scholars intersecting travel paths as part of their collaborative autoethnography. This image is a snapshot of a minute-long animation sequence depicting an accurate representation of their travel through time. I created several animation sequences involving zooming in and out of these ‘lines of flight’, and these were put on display in an art gallery at Florida State University in the Spring of 2016. Creation of these animations required learning ArcGIS Animation Manager suite with out any supervision, which was quite a feat! I am grateful for Dr. Joseph Weber for his fantastic instruction in the basics of ArcGIS and Dr. Kelly Guyotte – my supervisor for this project – and her collaborators for entrusting this task to me. I felt honored to share in the production of a manifestation of their study.